The Ultimate Pandas Cheat Sheet for Data Scientists
Master the Pandas library for efficient data manipulation with this comprehensive cheat sheet tailored for data scientists.
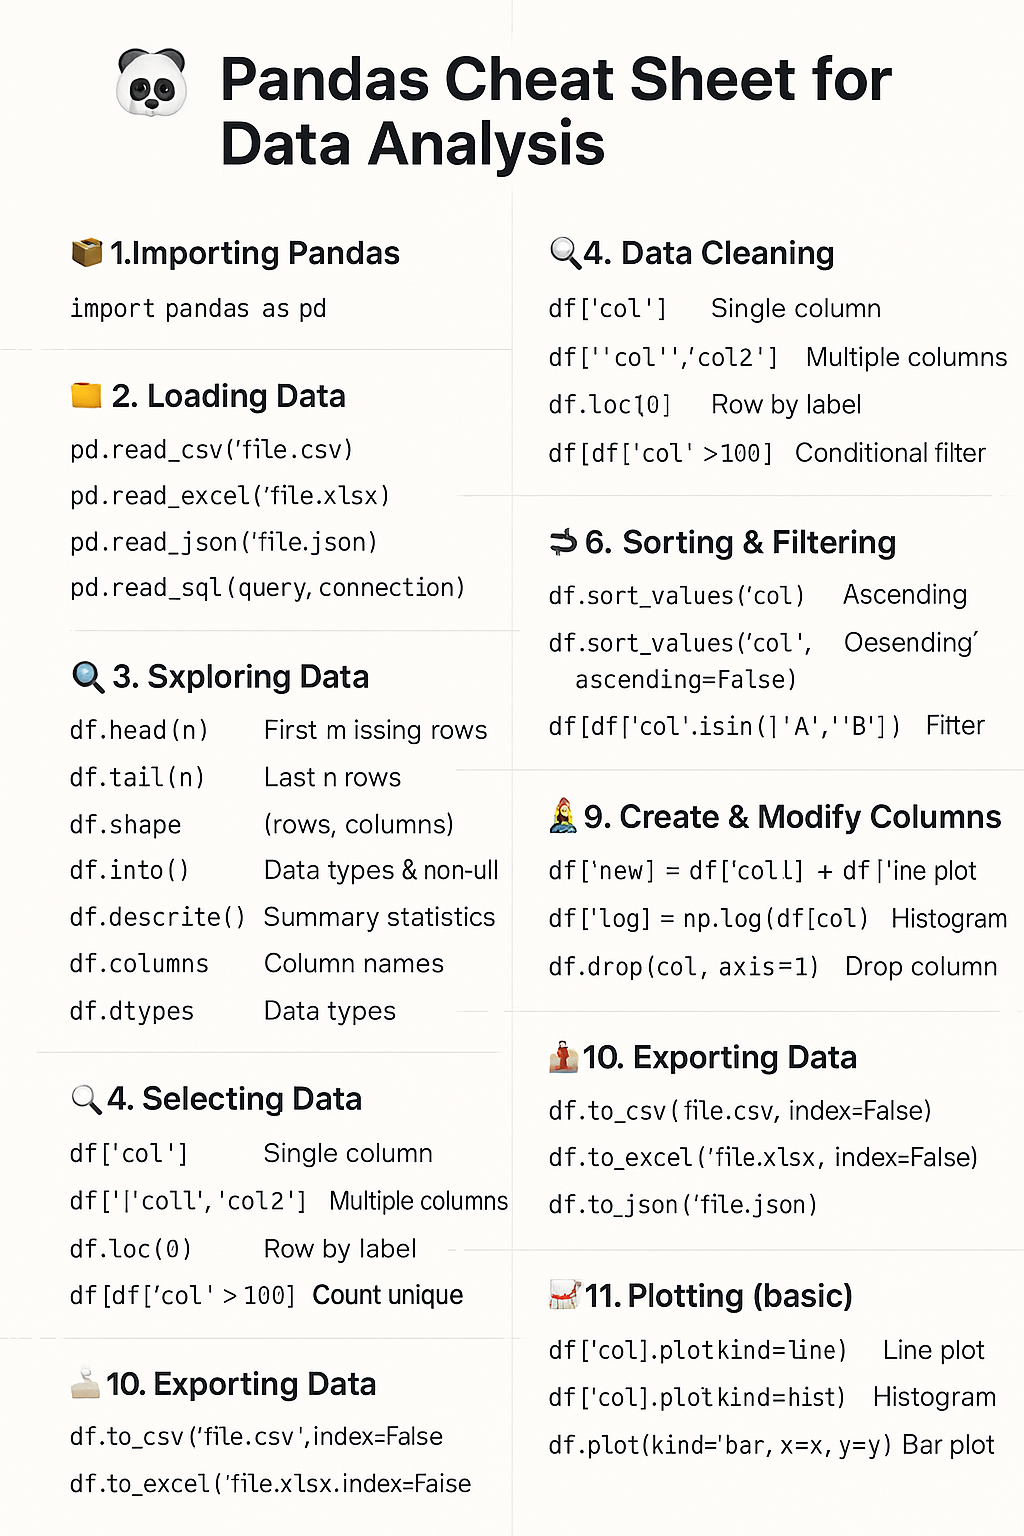
🐼 The Ultimate Pandas Cheat Sheet for Data Scientists
When it comes to data science with Python, Pandas is the go-to library for powerful and efficient data manipulation. Whether you’re cleaning messy datasets, exploring trends, or preparing data for machine learning models, Pandas streamlines the process with intuitive and flexible syntax.
This blog post provides a comprehensive Pandas cheat sheet—perfect for quick reference or a complete refresher.
📦 1. Importing Pandas
import pandas as pd📂 2. Loading Data
pd.read_csv('data.csv')            # Load CSV
pd.read_excel('data.xlsx')         # Load Excel
pd.read_json('data.json')          # Load JSON
pd.read_sql(query, connection)     # Load from SQL database
🔍 3. Exploring the Dataset
df.head()          # First 5 rows
df.tail()          # Last 5 rows
df.shape           # (rows, columns)
df.info()          # Data types & nulls
df.describe()      # Summary stats
df.columns         # Column names
df.dtypes          # Data types
🧹 4. Cleaning the Data
df.dropna()                         # Drop rows with NA
df.fillna(0)                        # Replace NA with 0
df.rename(columns={"old": "new"})   # Rename columns
df.astype({"col": float})           # Convert types
df.duplicated().sum()               # Check duplicates
df.drop_duplicates()                # Drop duplicates
🔎 5. Selecting Data
df['col']                    # Single column
df[['col1', 'col2']]         # Multiple columns
df.loc[5]                    # Row by index label
df.iloc[5]                   # Row by position
df[df['col'] > 100]          # Filter rows
🔁 6. Sorting and Filtering
df.sort_values('col')                     # Ascending
df.sort_values('col', ascending=False)    # Descending
df[df['col'].isin(['A', 'B'])]            # Filter by values
📊 7. Aggregations and Grouping
df.groupby('col').mean()                 # Group mean
df.groupby('col').agg(['mean', 'sum'])   # Multiple aggregations
df['col'].value_counts()                 # Frequency
🧮 8. Create or Modify Columns
df['new'] = df['col1'] + df['col2']       # New column
df['log'] = np.log(df['col'])             # Apply function
df.drop('col', axis=1)                    # Drop column
📅 9. Date and Time Handling
df['date'] = pd.to_datetime(df['date'])
df['year'] = df['date'].dt.year
df['month'] = df['date'].dt.month
df['day'] = df['date'].dt.day
📤 10. Exporting Data
df.to_csv('export.csv', index=False)
df.to_excel('export.xlsx', index=False)
df.to_json('export.json')
📈 11. Basic Plotting (using Matplotlib)
import matplotlib.pyplot as plt

df['col'].plot(kind='line')     # Line plot
df['col'].plot(kind='hist')     # Histogram
df.plot(kind='bar', x='x', y='y')  # Bar chart

plt.show()
📌 Summary Table
| Task | Pandas Code |
|---|---|
| Load CSV | pd.read_csv() |
| View data | df.head() |
| Drop NA | df.dropna() |
| Group by column | df.groupby() |
| Export to Excel | df.to_excel() |
🧠 Final Thoughts
Pandas is the Swiss Army knife for data scientists working in Python. This cheat sheet condenses the most essential operations into one handy guide. Keep it bookmarked and use it during your data wrangling adventures!
For more tutorials and tools, visit SuperML.dev