Linear Regression Explained: A Beginner’s Guide with Python Example
Learn how linear regression works, when to use it, and how to implement it with a simple Python example using real data.
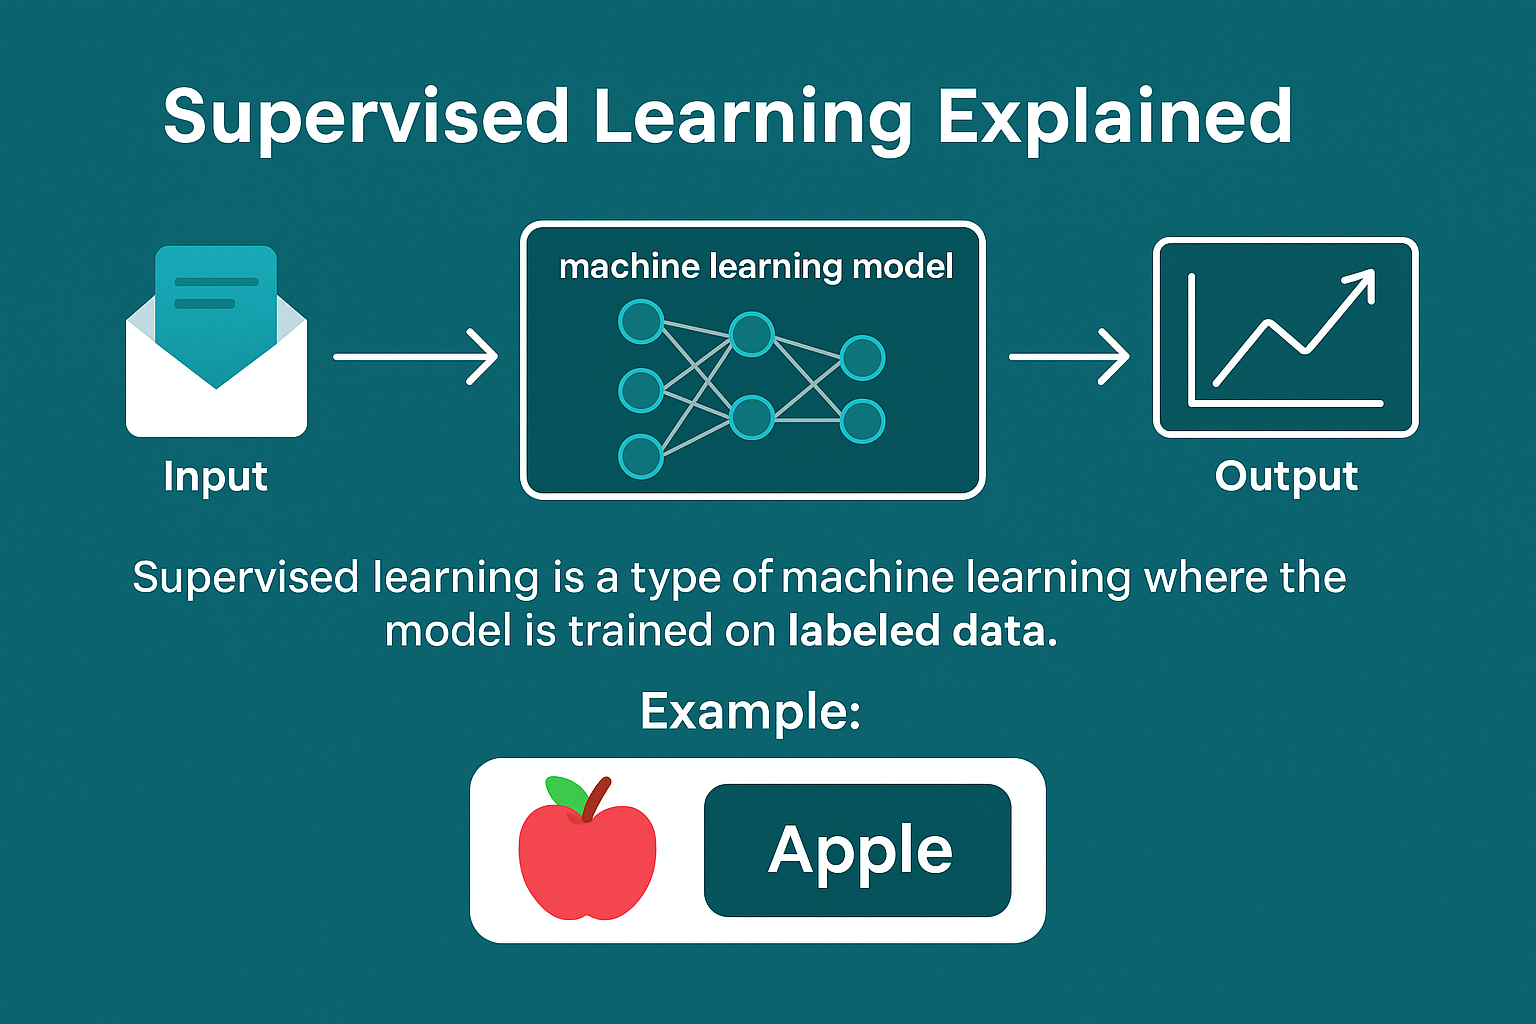
📈 What is Linear Regression?
Linear regression is one of the most fundamental algorithms in machine learning and statistics. It’s used to model the relationship between a dependent variable (target) and one or more independent variables (features).
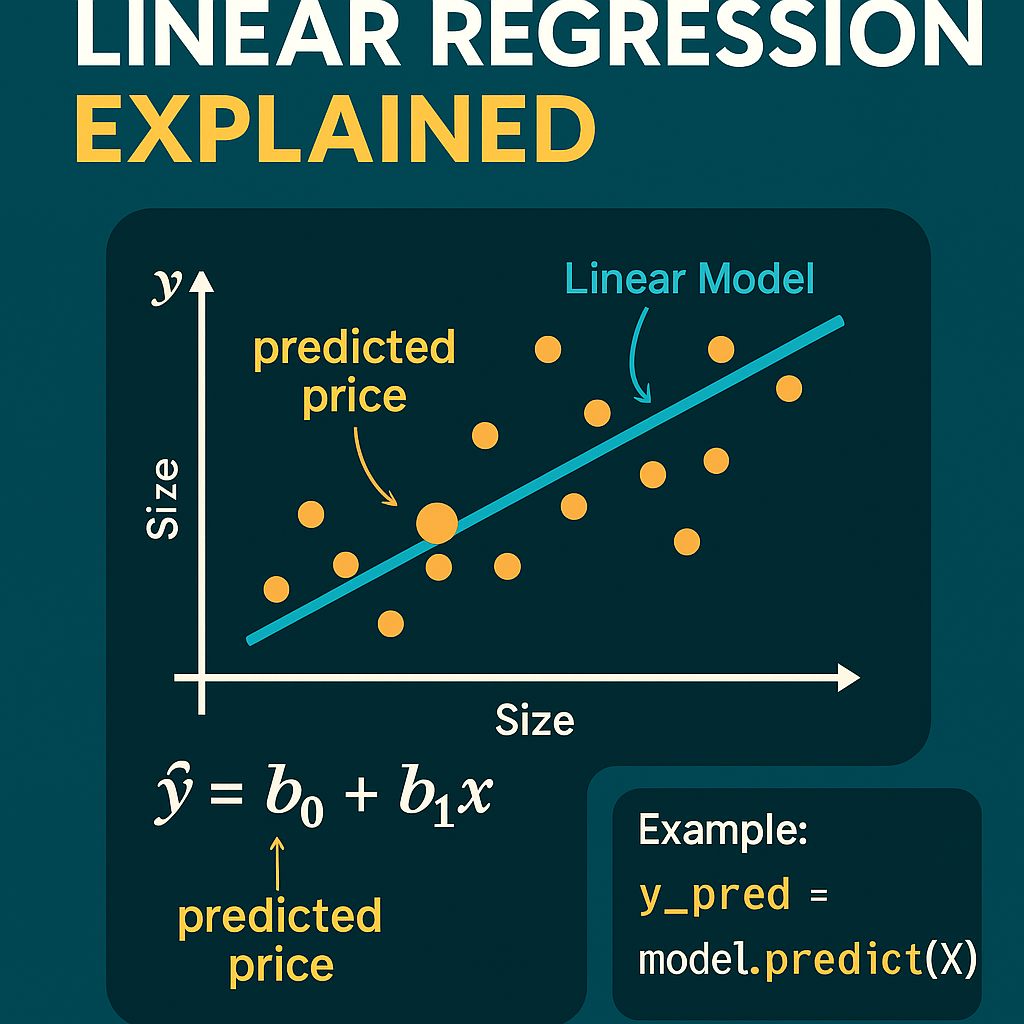
In simple linear regression, we draw a straight line that best fits the data points.
🧠 When to Use Linear Regression?
- When the relationship between input and output appears linear
- For predicting continuous values (e.g., price, temperature, salary)
- When interpretability is important (easy to explain coefficients)
🧮 The Linear Equation
The basic equation for linear regression is:
y = mx + bWhere:
y= predicted valuex= input featurem= slope (coefficient)b= intercept (bias)
In multiple linear regression (more than one feature), it becomes:
y = b + m1*x1 + m2*x2 + ... + mn*xn💻 Python Example: Predicting House Prices
import pandas as pd
from sklearn.linear_model import LinearRegression
from sklearn.model_selection import train_test_split
from sklearn.metrics import mean_squared_error

# Sample dataset
data = {
    'Size': [1000, 1500, 1800, 2400, 3000],
    'Price': [200000, 250000, 280000, 310000, 370000]
}
df = pd.DataFrame(data)

# Features and target
X = df[['Size']]  # input
y = df['Price']   # output

# Train-test split
X_train, X_test, y_train, y_test = train_test_split(X, y, test_size=0.2, random_state=42)

# Model
model = LinearRegression()
model.fit(X_train, y_train)

# Prediction
predictions = model.predict(X_test)
print("Predicted prices:", predictions)
print("Mean Squared Error:", mean_squared_error(y_test, predictions))
📊 Visualization Tip
To visualize the regression line:
import matplotlib.pyplot as plt

plt.scatter(X, y, color='blue')  # actual data
plt.plot(X, model.predict(X), color='red')  # regression line
plt.xlabel("Size (sq ft)")
plt.ylabel("Price ($)")
plt.title("Linear Regression: House Prices")
plt.show()
✅ Strengths
- Simple and fast
- Easy to interpret
- Works well with linearly separable data
❌ Limitations
- Struggles with non-linear relationships
- Sensitive to outliers
- Assumes homoscedasticity and normal distribution of errors
🧭 Conclusion
Linear regression is a great starting point for any regression task. It helps you understand your data, find patterns, and build predictive models. With just a few lines of Python code, you can apply it to real-world datasets and begin your machine learning journey.
Ready to try it? Grab a dataset and draw your first regression line!